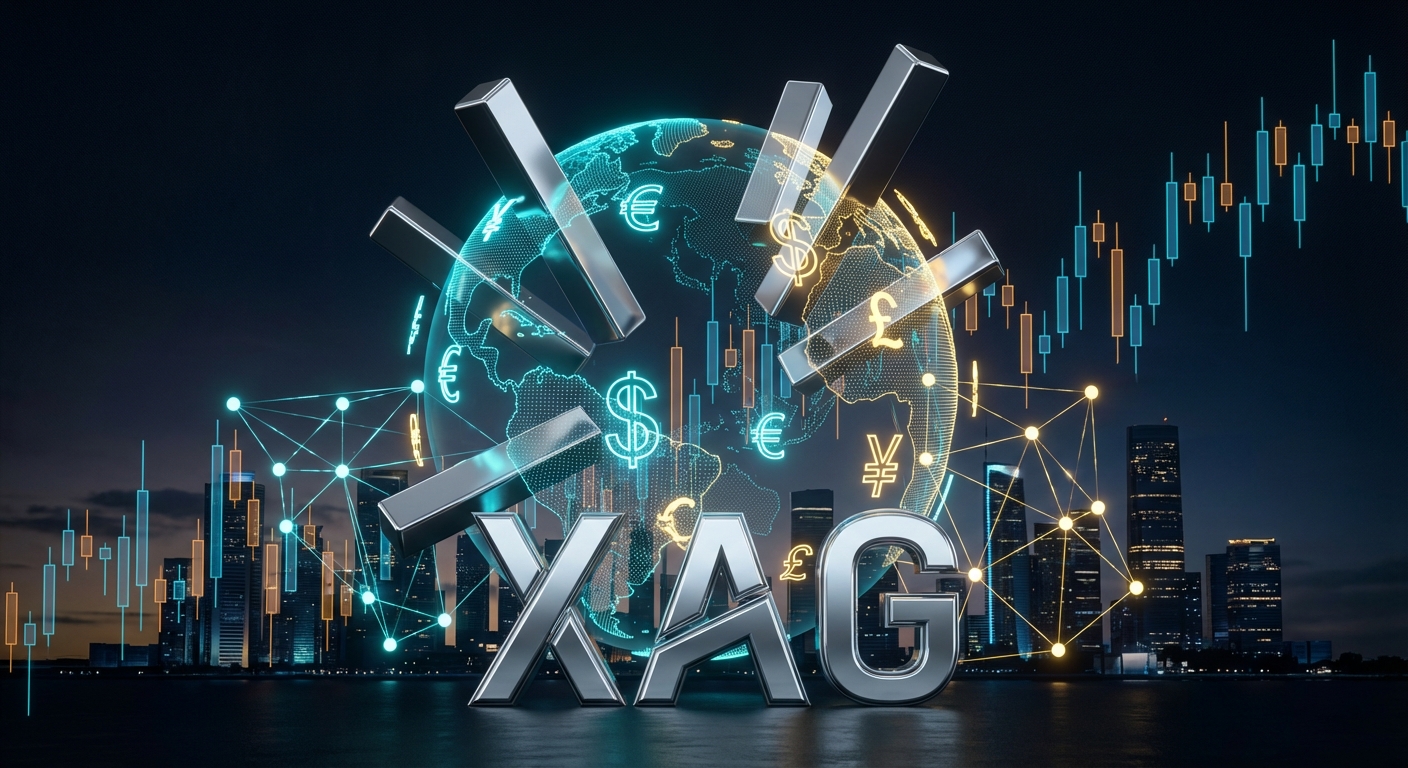
The commodities market has experienced today, December 29, 2025, one of its most volatile and significant sessions of the decade. While global equity markets remain near all-time highs on reduced holiday trading volume, the price of silver has staged an explosive move, surpassing $80 per ounce for the first time in history. This 6% rally at the open, followed by an abrupt correction, has raised alarms among analysts and traders debating whether we are witnessing a real supply contraction or irrational year-end exuberance.
Silver’s parabolic move is not an isolated event but the culmination of a year marked by dollar weakness and unprecedented industrial demand. However, the magnitude of today’s move—taking the white metal to uncharted territory well above its inflation-adjusted historical highs—suggests market dynamics have fundamentally changed. Tony Sycamore, market analyst at IG Australia, did not hesitate to describe the situation in blunt terms: “We are witnessing a generational bubble developing in silver.”
“Relentless industrial demand from solar panels, electric vehicles, and AI data centers, pressing against depleted inventories, has driven physical premiums to never-before-seen extremes.” — Tony Sycamore, IG Australia
Market Context: The Perfect Storm for Metals
To understand the magnitude of $80 silver, we must look at the macroeconomic picture at this 2025 year-end. The Dollar Index (DXY) has fallen 10.3% year-to-date, according to latest market data, weakened by a Federal Reserve that has executed three 25-basis-point rate cuts since September, placing benchmark rates in the 3.5% – 3.75% range. This more “balanced” but dovish monetary policy has acted as a constant tailwind for dollar-denominated assets.
Furthermore, gold had already paved the way, reaching records near $4,550 recently. Silver, which historically acts with higher “beta” than gold (more explosive movements), had been lagging until today. The narrative has shifted from being a monetary safe-haven asset to being a critical industrial input. The massive expansion of Artificial Intelligence infrastructure and the ongoing energy transition have drained physical inventories in London and Shanghai, creating a “short squeeze” in the futures market.
Technical and Fundamental Analysis
The behavior of the XAG/USD pair today has been textbook for a bullish capitulation or “blow-off top.” After opening the Asian session with a bullish gap and climbing 6% above $80, the price quickly reversed, falling more than 2% from those intraday highs. This type of price action, known as a “key reversal,” usually indicates short-term exhaustion, but the underlying trend remains fiercely bullish.
In the foreign exchange market, this dollar weakness driving commodities is reflected in the major pairs:
| Asset / Pair | Key Data (12/29/2025) | Technical Context |
|---|---|---|
| Silver (XAG/USD) | Record > $80.00 | Extreme volatility. Immediate support to watch after reversal. |
| EUR/USD | ~1.1760 | Testing support at 9-day EMA (1.1757). Uptrend intact but losing momentum. |
| USD/JPY | 156.32 | Yen recovers slightly (-0.15% today) following BoJ hawkish signals. |
| Dollar Index (DXY) | -10.3% YTD | Annual bearish consolidation. Fed has confirmed end of aggressive tightening. |
It is crucial to note that, although EUR/USD shows signs of fatigue near 1.1760, the 14-day RSI remains above its midline, suggesting buyers still control the overall structure. On the other hand, USD/JPY remains vulnerable; despite trading at 156.32, the divergence between a Bank of Japan raising rates (recently to 0.75%) and a Fed cutting them is compressing the yield differential.
¿Listo para operar como un profesional?
Únete a Foxentrade y accede a estrategias de copytrading profesionales con gestión de riesgo institucional.
Comenzar ahoraImplications for Traders
The $80 breakout in silver changes the game for retail traders. Current volatility means typical stops can be swept in seconds. The “generational bubble” warning suggests that, while price could rise further by inertia, the risk of a violent correction is maximum.
Key points to consider:
* Leverage management: With silver moving 6% in hours, standard leverage can liquidate accounts quickly. Reducing position size is imperative.
* Watch the Gold/Silver ratio: With gold consolidating near $4,550 and silver spiking, the ratio is compressing. If silver corrects, it could do so much faster than gold.
* Correlation with AUD: The Australian Dollar (AUD) often benefits from high metal prices. Watch AUD/USD, which recently broke a 4-year downtrend resistance, for continuation opportunities.
* EUR/USD levels: If the pair loses the 9-day EMA support at 1.1757, we could see a correction toward 1.1673 (50-day EMA). Maintain vigilance at this pivot level.
Short-Term Outlook
Heading into the first week of 2026, attention will focus on whether silver can consolidate above $75-$78 or if the $80 rejection marks a temporary ceiling. Liquidity will gradually return to markets after New Year’s, which could smooth erratic movements or, conversely, confirm the breakout if institutional investors who have been on the sidelines enter.
The macroeconomic consensus for 2026 points to slower global growth (U.S. projected at 1.8%) and a lower rate environment. This creates a fundamental floor for precious metals, but today’s euphoria requires caution. As the IG Australia report notes, physical demand is real, but vertical markets rarely end without a healthy correction. For the Forex trader, dollar weakness remains the dominant trend, but pair selection and precise entry will be vital in this high-beta environment.